1. Accuracy
(1) Precisionδ
It indicates that
Instrument indicationThe dispersion of values refers to the degree of dispersion of measurement results (indicated values) for a stable measured object, measured multiple times in a relatively short period of time by the same measurer using the same instrument& Delta; The smaller the measurement, the more precise it is.
For example, the precision of a temperature instrument&delta= 0.5 ℃ means that the dispersion of multiple measurement results is not greater than 0.5 ℃. Precision is a sign of the size of random errors, and high precision means small random errors.
However, it must be noted that precision and accuracy are two concepts, and high precision may not necessarily be accurate.
(2) Accuracyε
It indicates the degree of deviation between the indicated value of the instrument and the true value.
For example, the accuracy of a certain flow meter&epsilon= 0.3m3/s indicates that the indicated value of the instrument deviates from the true value by 0.3m3/s. Accuracy is a sign of the size of system error, and high accuracy means small system error. Similarly, high accuracy does not necessarily mean precision.
(3) Accuracyτ
It is a comprehensive reflection of precision and accuracy, with high accuracy, indicating that both precision and accuracy are relatively high. In the simplest case, the algebraic sum of the two can be taken, i.e.&tau=& Delta+& Epsilon;. Accuracy is often expressed as the relative value of measurement error.
2. Stability
(1) Stability
Refers to the change in the indicated value caused by the instrument's own random changes, periodic changes, drift, etc., within a specified period of time, without changing the measurement conditions. Generally, it is expressed together with the precision value of the instrument and the length of time.
For example, if the voltage indication value of a certain instrument changes by 1.3V per hour, the stability can be expressed as 1.3mV/h.
(2) Impact quantity
The amount of change in the indicated value of a measuring instrument caused by changes in the external environment is called the influence quantity. It is caused by external environmental influences such as temperature, humidity, air pressure, vibration, power voltage, and power frequency. When explaining the impact amount, it is necessary to indicate both the influencing factors and the deviation from the indicated value.
For example, if a certain instrument changes its indicated value by 0.02mA due to a 10% change in power supply voltage, it should be written as 0.02mA/U± 10%.
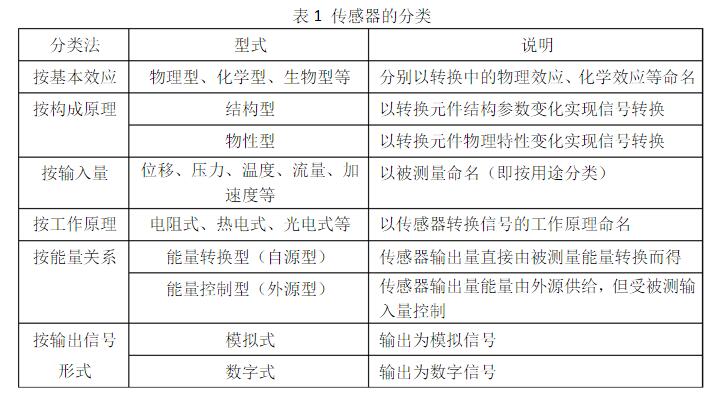
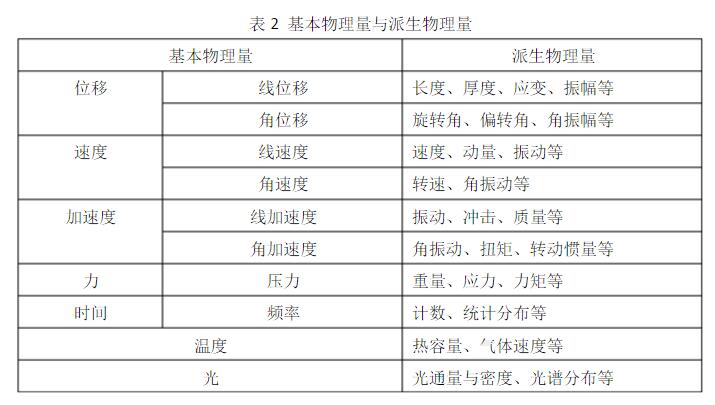
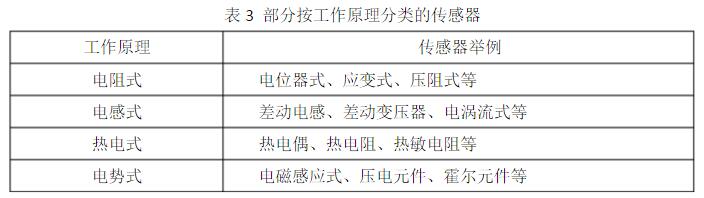
2、 Classification and performance indicators of sensors
1. Classification of sensors
2. Performance indicators of sensors
(1) Range and range
Range refers to the algebraic difference between the upper and lower limits of measurement; Range refers to the range of upper and lower limits that an instrument can measure with a specified accuracy. For example, if the lower measurement limit of a displacement sensor is -5mm and the upper measurement limit is+5mm, then the range of this sensor is 5- (-5)=10mm and the measurement range is -5mm~5mm.
(2) Linearity
The deviation between the input output relationship curve of the sensor and its selected fitting line.
(3) Repeatability
The degree of consistency between the characteristic curves obtained by the sensor when the input is continuously measured multiple times in the same direction under the same working conditions.
(4) Hysteresis loop
During the forward (increase in input) and directional (decrease in input) travel processes of the sensor, its output is; The degree of non coincidence of input characteristics.
(5) Sensitivity
The ratio of the change value output by the sensor to the corresponding measured change value.
(6) Resolution
The minimum increment of the measured signal that the sensor may detect within the specified measurement range.
(7) Static error
The degree to which the output value of a sensor deviates from the theoretical value at any point within its full range.
(8) Stability
The difference between the output of a sensor and the output of the initial calibration time after a specified time interval at room temperature.
(9) Drift
Within a certain time interval, the output of the sensor undergoes unnecessary changes that are independent of the input quantity under external interference. Drift includes zero drift and sensitivity drift.
Due to the fact that the non electrical quantity measured by the sensor does not change over time or changes slowly, as well as changes quickly at any time, the performance indicators of the sensor not only include the static characteristics mentioned above, but also dynamic characteristics, which can be analyzed from two aspects: step response and frequency response.
3、 Resistive sensor
1. Definition: A resistive sensor uses a resistive element to exchange changes in measured physical quantities, such as force, displacement, deformation, and acceleration, into changes in the resistance value. By measuring the resistance value, the purpose of measuring this physical quantity is achieved.
2. Classification: Resistance sensors can be mainly divided into potentiometer type resistance sensors and strain type resistance sensors. The former is suitable for situations where the parameters of the tested object change significantly, while the latter works in situations where the resistance value changes very little and has high sensitivity.
4、 Thermocouple
1. The thermoelectric effect involves two different types of conductors tightly connected at both ends, forming a closed loop. When the temperature of the two contacts is not equal, an electromotive force will be generated in the circuit, forming a current. This phenomenon is called the thermoelectric effect, and this electromotive force is called the thermoelectric electromotive force. 2. The Basic Law of Thermocouples
(1) The law of intermediate conductors. In the thermocouple circuit composed of materials A and B, a third conductor C is connected. As long as the temperature at both ends of the introduced third conductor is the same, the introduction of this conductor will not change the magnitude of the electromotive force Eab (T, T0). This law is called the law of intermediate conductors.
(2) Standard electrode law. If the thermoelectric electromotive force generated by the thermocouple composed of two conductors (A and B) and a third conductor (C) is known, the thermoelectric electromotive force generated by the thermocouple composed of these two conductors (A, B) can be determined by the following standard electrode law: EAB (T, T0)=EAC (T, T0) - EBC (T, T0). From this, it can be seen that when the thermoelectric electromotive force generated by a thermocouple composed of any few thermoelectric electrodes and a standard electrode is known, It is very convenient to calculate the thermoelectric electromotive force when these thermoelectric electrodes are arbitrarily combined with each other.


 Sales Engineer - Miss Chen